Housing Sales in South Bay Zip Codes

08-24-2018
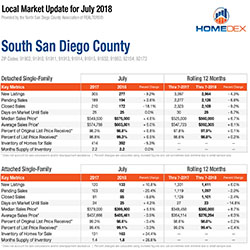
PSAR members have access to the HomeDex Report that details the latest residential real estate market activity in San Diego’s South County region in the following zip codes: 91902, 91910, 91911, 91913, 91914, 91915, 91932, 91950, 91954 and 92173. PSAR is proud to offer this research tool as a member benefit. Among the latest statistics on activity in the South County in July 2018:
-- The median sales price for a detached single-family home in South San Diego County reached $575,000 in July 2018, which was 4.6 percent higher than the $549,500 price in July 2017. The July 2018 monthly figure for detached homes is higher than the year-to-date median sales price of $560,000.
-- For attached homes, the median home price in the South County was $399,900 in July 2018, which was an 5.5 percent increase compared to the $379,000 price the same month a year ago. The July 2018 monthly figure for attached homes is higher than the year-to-date median sales price of $380,000.
-- The average number of days for a South County home on the market (the time between when a property is listed and an offer is accepted) was 25 days for detached homes and an identical 25 days for attached homes. In July 2017, the numbers were 25 and 24 days, respectively.
-- Closed sales totaled 172 detached units in July 2018, which was an 18.1 percent year-over-year drop compared to the 210 units sold in July 2017. For attached home sales, closed sales totaled 85 in July, a 6.6 percent decline from July 2017’s total of 91.
-- The percentage of original list price received for detached homes was 98.8 percent in July, a 0.8 percent change from 98.0 percent in July 2017. For attached homes, the percentage was 98.6 percent, a 0.4 percent difference from 99.0 percent in July 2017.
-- The number of new detached listings on the market in July totaled 277, a 9.2 percent decrease from the 305 new listings in July 2017. For new attached listings, the total was 133 in July, a 10.8 percent increase from the 120 new listings in July 2017.
-- The year-to-date totals for detached listings was 2,964 through July, a 4.3 percent decrease from 3,097 listings through July 2017; the year-to-date total for attached property listings was 1,422 through July, a 6.0 percent increase from the 1,331 listings through July 2017.
According to the HomeDex Report, housing price bubble chatter has increased this summer because market observers are always try to predict the next residential real estate shift, but it is too early to expect a change from higher prices and lower inventory, even though the common markers that caused the last housing cool-down are present. Wages are up but not at the same pace as home prices, leading to the kind of affordability concerns that can cause fewer sales at lower prices. At the same time, demand is still outpacing what is available for sale. With a growing economy, solid lending practices and the potential for improved inventory from new listing and building activity, market balance is more likely than a bubble.
The HomeDex South San Diego County report for July 2018 is available here, https://nsdcar.stats.10kresearch.com/docs/lmu/2018-07/x/SouthSanDiegoCounty?src=map
